Modern meteorology saves lives. During summer months in humid climates, meteorologists fill our screens with forecasts for high temperatures, rising dew points, and extreme heat indices. Corresponding heat advisories from the National Weather Service warn of the life-threatening circumstances for those who fail to exercise discretion in their outdoor activities. To ensure our safety, we are cautioned to slow down, hydrate, and stay indoors. But for those who fought in the Civil War, there were no such warnings, nor were such discretions allowed to be the better part of valor. The recent discovery of certain primary-source weather data, however, allows us to reach back in time and project modern science on the human experience of those who fought in the war.
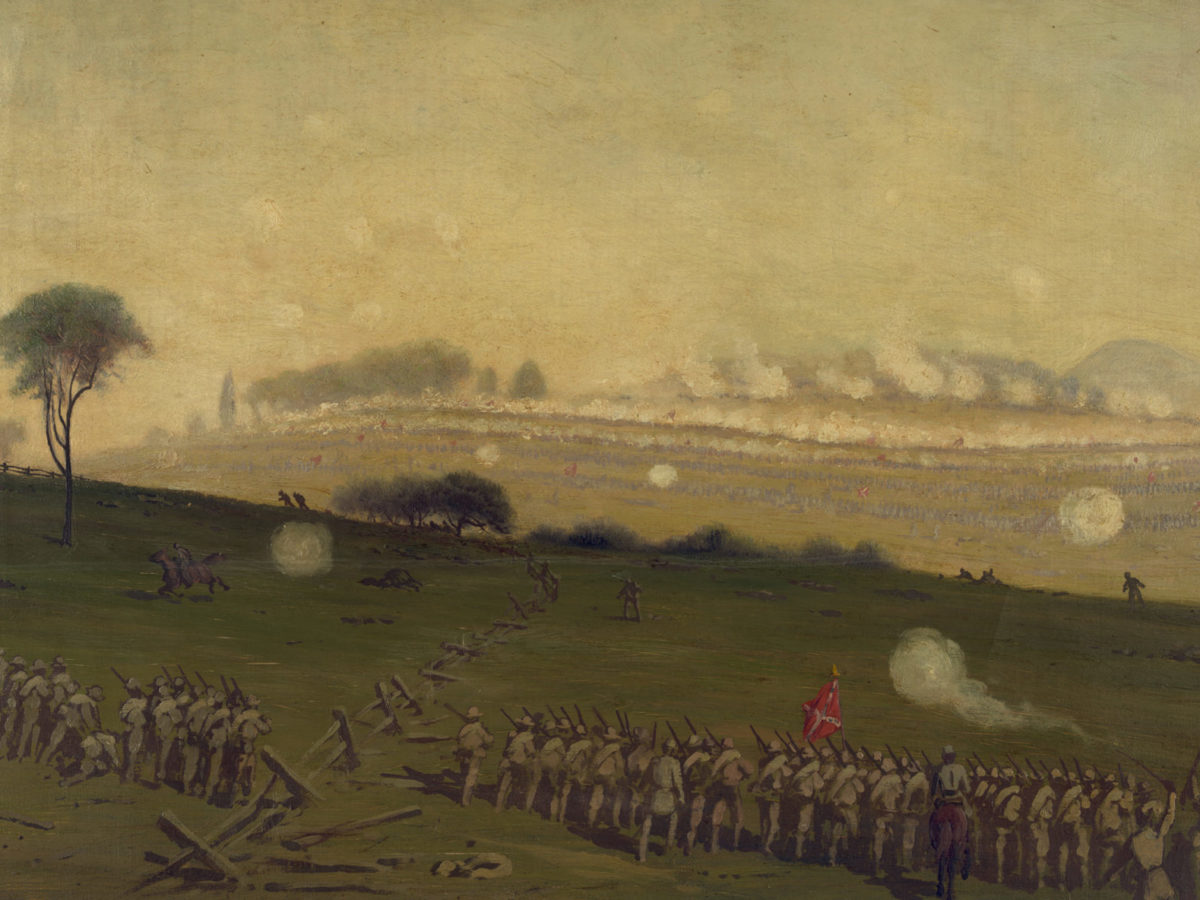
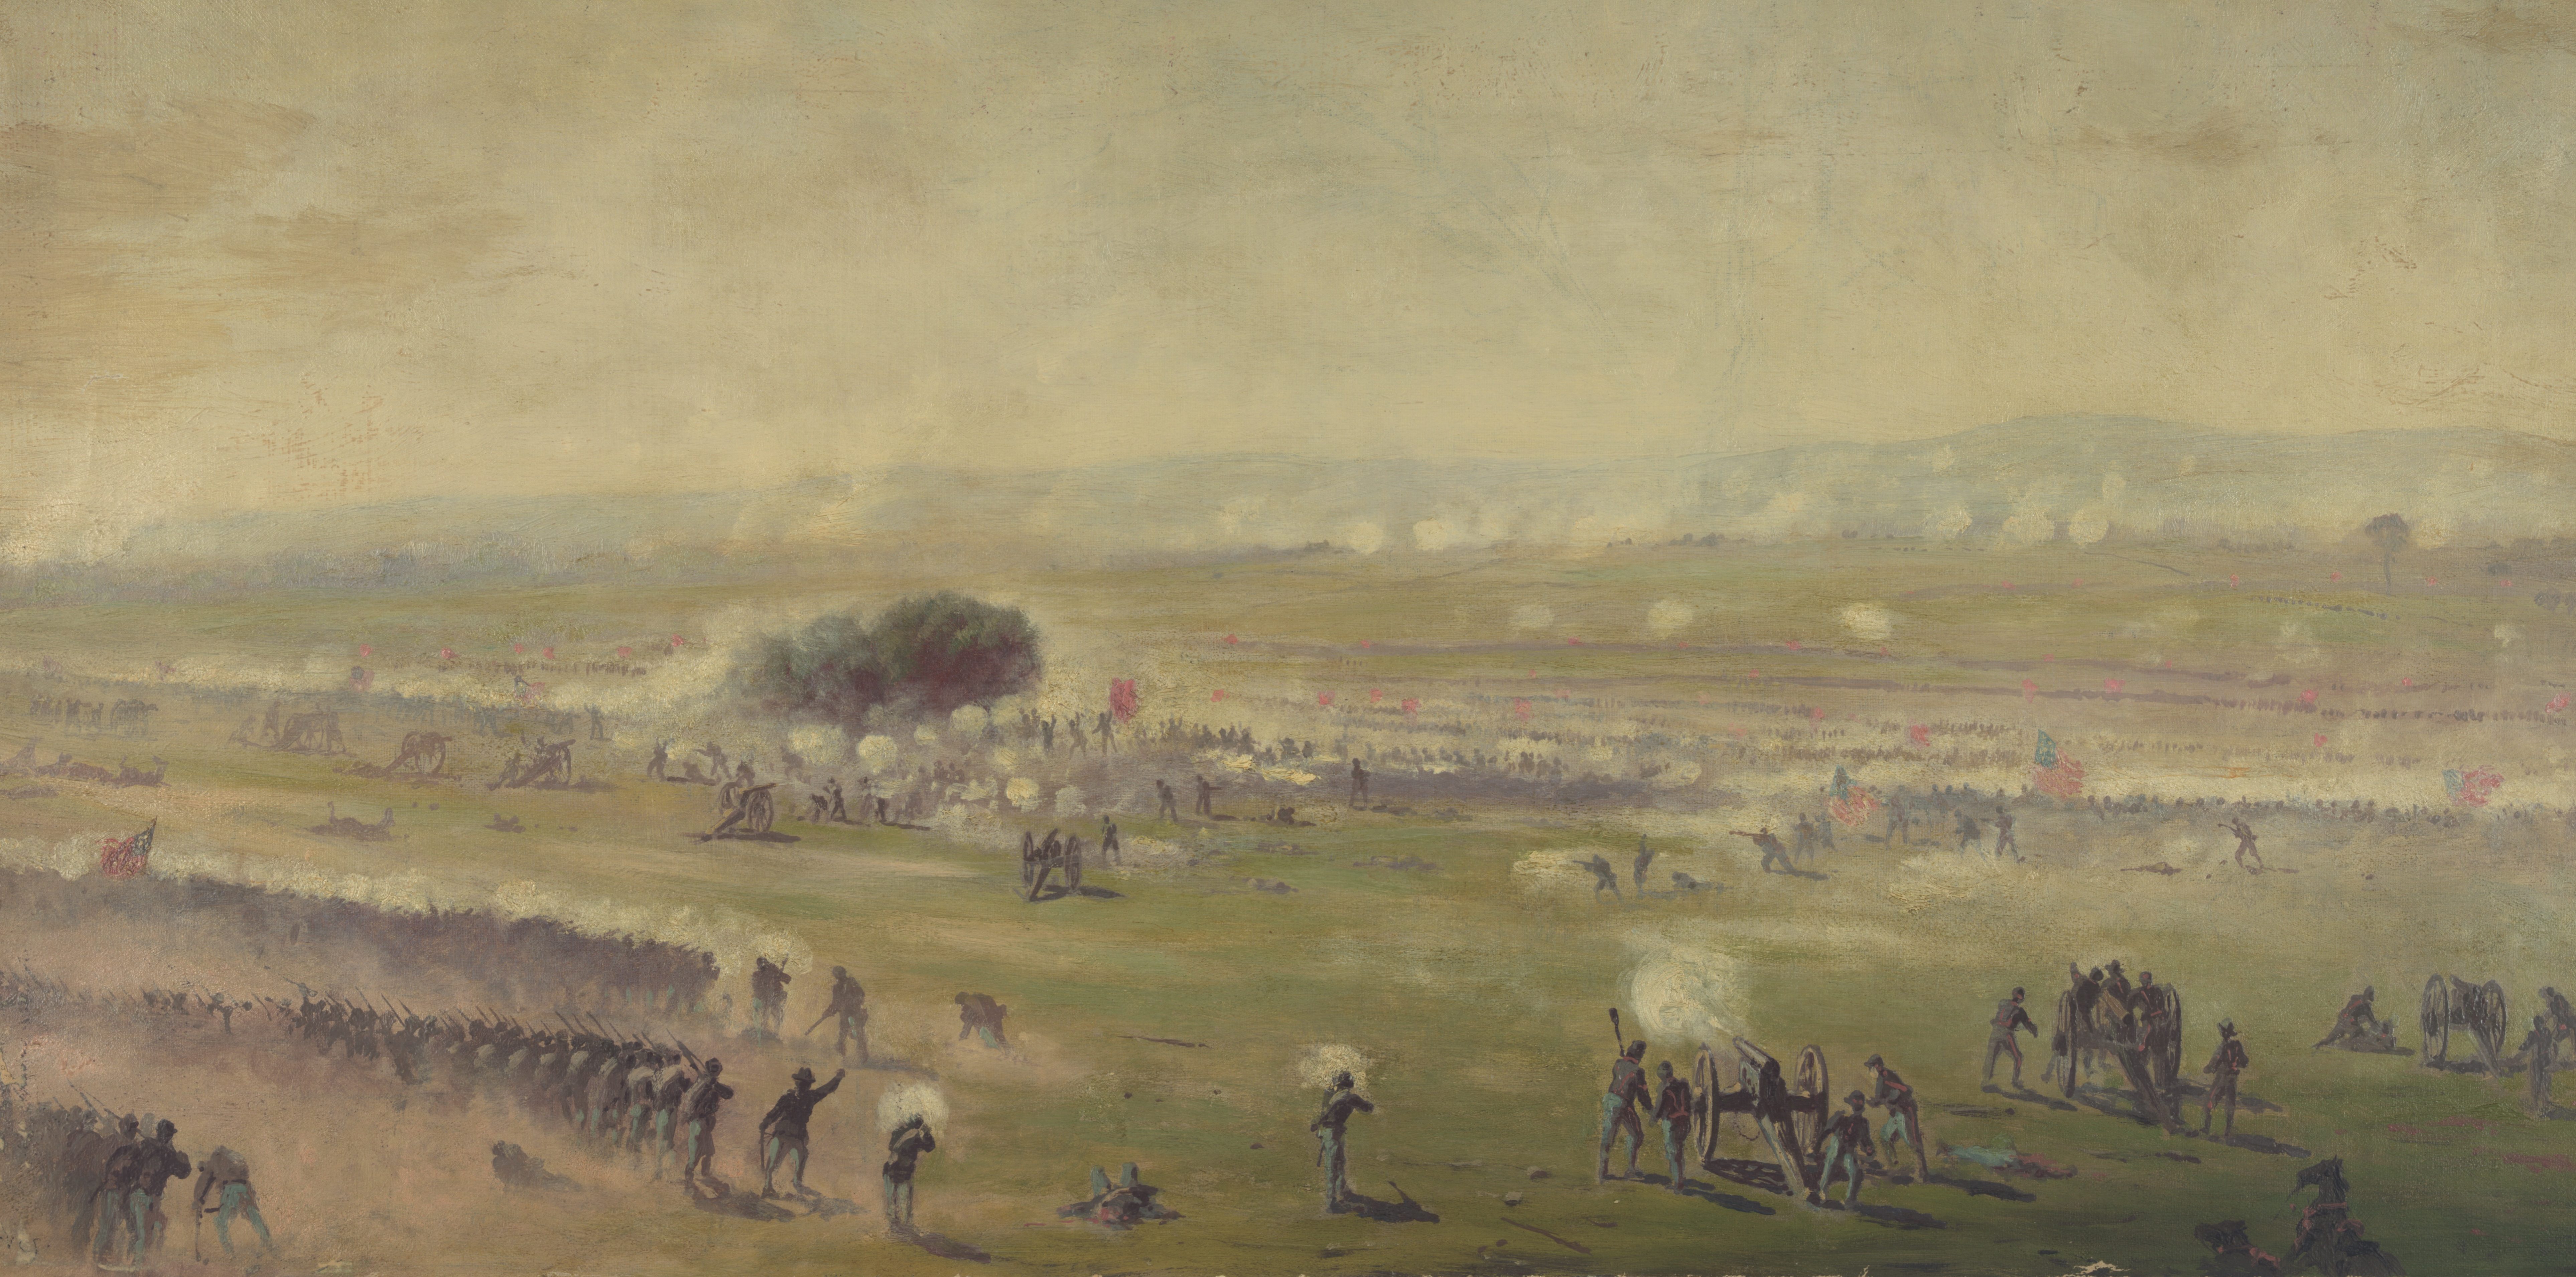
As a licensed battlefield guide at Gettysburg, one of the most frequent questions I am asked by visitors is, “How hot did it feel to the soldiers during Pickett’s Charge?” For most, this is an idle curiosity. But for historians, the question has always been, “were the actual weather conditions severe enough to play a role in the outcome of the charge?” Unfortunately, though we knew what the temperature was an hour before the charge on July 3, 1863, we did not know what the measure of atmospheric moisture was, so we could never say with certainty what the weather felt like. And without that key data, we could never engage in a meaningful conversation about the weather’s potential impact on the climactic attack.
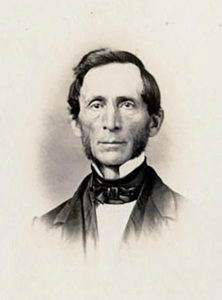
Weather observation data faithfully recorded during the battle by Pennsylvania College’s Professor Michael Jacobs, who was doing so on behalf of the Smithsonian Institution, indicated a high temperature of 87°F an hour before the charge. Historians, however, have long assumed that it must have felt much hotter. And with good reason, for in the mid-Atlantic region oppressive summertime “Bermuda” high pressure systems typically prevail. But assumptions are one thing. The practice of history requires documentary proof. Unfortunately, the steadfast Jacobs was not in the habit of recording measurements of atmospheric humidity, so his data could not be used to determine dew point, and in turn, heat index. So, end of story—right? Not quite.
Recommended for you
During Gettysburg’s 158th anniversary, this author and meteorologist Jon Nese, Ph.D., revealed, for the first time, a reliable estimate of what the dew point and ever-important heat index measurements likely were during the battle. These findings were based on analysis of primary-source weather observation data recorded in Harrisburg, Pa., only 35 miles from Gettysburg. Fortunately, unlike Gettysburg’s Professor Jacobs, the two weather observers in Harrisburg did record measurements of atmospheric humidity, called “wet bulb temperature.” And it was these measurements that allowed for the first-ever scientifically based estimate of humidity, dew point and ultimately, heat index—not only at capital city Harrisburg, but by extrapolation, at nearby Gettysburg.
To ensure accuracy, our analysis also factored in primary-source weather observation data from other nearby locations, a reconstruction model of weather maps from the period using a newly developed program created by the National Oceanic and Atmospheric Administration (NOAA), and a comparison of modern data from Gettysburg and Harrisburg over a 30-year period.
Taking all of this into consideration, our analysis provided some eye-popping results—namely a robust estimate indicating that at Gettysburg, on July 3, 1863, at 2 p.m., an hour before Pickett’s Charge, the dew point measured a stifling 76°F and the heat index measured a perilous 98°F degrees. And, in considering the fact that daily high temperatures normally occur later in the day (typically a few degrees higher), our estimations indicate the heat index at the time of the charge (3–4 p.m.) may have been as high as 105°F! With this, we now have a reliable estimate of how the weather felt to the soldiers during Pickett’s Charge. In turn, historians finally have the opportunity for a meaningful discussion of how the weather may have affected the charge. But ultimately, the benefits of our project go far beyond Gettysburg.
As we have seen, the ability to identify dew point and heat index stems from the efforts of various mid–19th century America weather observers, such as the aforementioned Harrisburg observers. And by the time the Civil War had begun, an extensive network of weather observation stations had been established on behalf of the Smithsonian (under the title of the Smithsonian Meteorological Project). In the early 1960s, the late weather historian David Ludlum was one of the first to use the Smithsonian’s records to analyze weather conditions during the Battle of Gettysburg.
More recently, historian Robert K. Krick’s 2007 landmark Civil War Weather in Virginia used Smithsonian weather-observer records from Georgetown, D.C., to project what the weather might have been in Virginia during the Civil War. Krick wisely gave context to his data by presenting numerous firsthand accounts for any given month during the war in order to give us what was, at the time, our best understanding of the weather in Virginia during the war.
Ken Noe’s The Howling Storm—Weather, Climate, and the American Civil War has contributed greatly to our overall understanding of the effect of environmental conditions during the war across all theaters of action. But until now, no data has been presented to indicate, with any degree of certainty, what the dew point and heat index conditions might have been during the war except for our recent project highlighting the conditions at Gettysburg. But now, by applying our Gettysburg model, we can analyze previously unused weather observation data from the period to reveal dew point and heat index conditions elsewhere during the war. And the Virginia “theater of war” represents once such location.
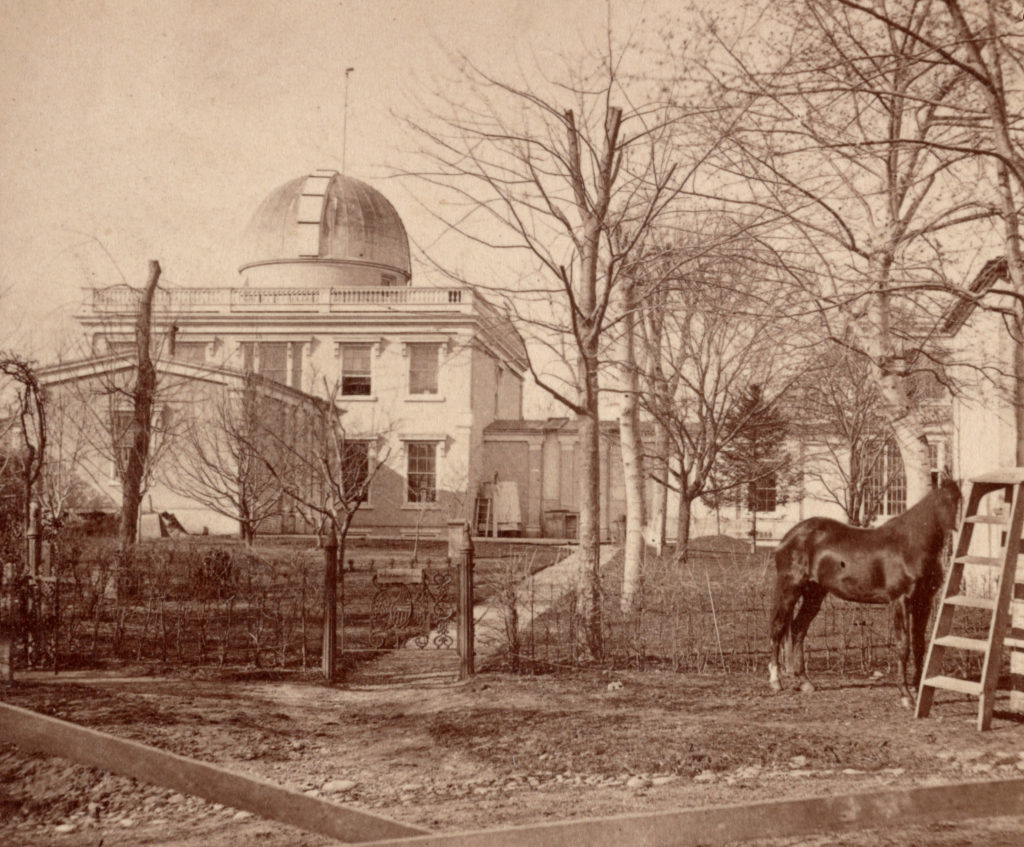
The “gold mine” source that allows for the projection of dew point and heat index measurements for Virginia comes in the form of weather-observation data recorded in Washington, D.C., at a government location that was then identified as the “Observatory, Washington City” (hereafter, the Observatory). The records used in Civil War Weather in Virginia from Georgetown did not include measurements of atmospheric moisture. Those from the Observatory, however, did. And thanks to those measurements, accurate figures for dew point and heat index in Washington, D.C., can be determined for virtually any date during the war for which conditions and corresponding data allow. Typically, heat index measurements described as being in the “extreme caution” zone, or worse, can be computed only for instances when temperatures are above 80°F. And most often these conditions occur during summer and shoulder season months (i.e., May and September).
It must be stated here that any measurement that is projected for a given location in Virginia, say Cedar Mountain, based on Washington data (e.g., the Observatory), must be considered in conjunction with the distance between the two sites, elevation differences, and differences in typically prevailing weather patterns. Although a complete analysis along these lines is beyond the scope of this article, a cursory look at two examples of the heat-related periods in Virginia, during which key actions occurred, clearly illustrates the potential benefits of a full analysis.
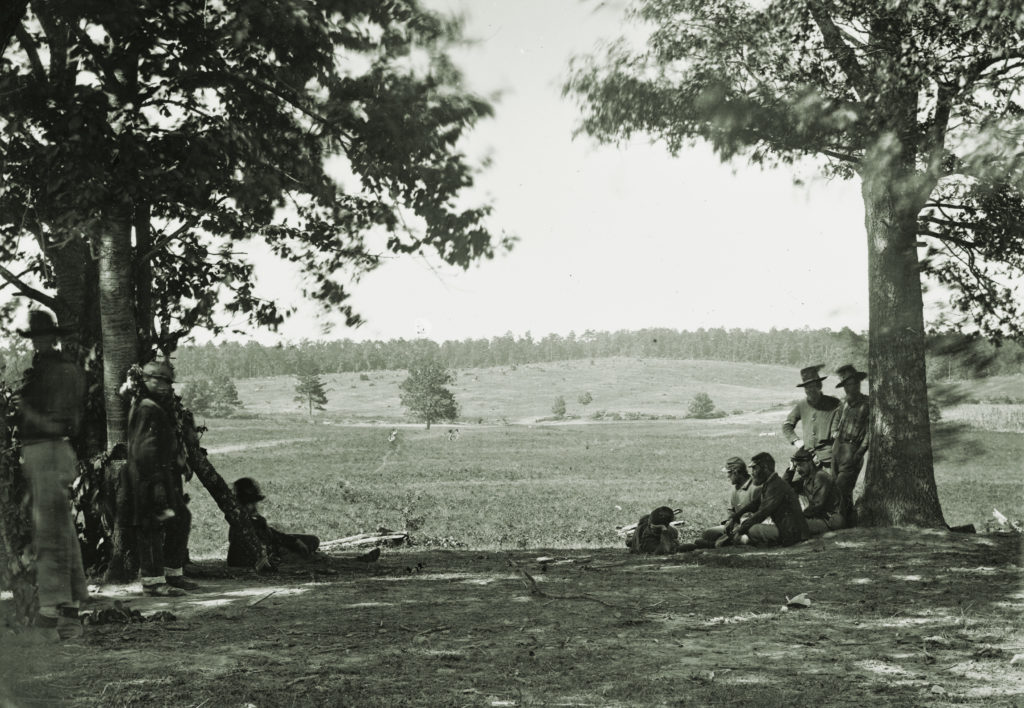
August 5–12, 1862—Battle of Cedar Mountain. Robert K. Krick likely said it best in his Stonewall Jackson at Cedar Mountain, “That environmental factors affect military affairs, sometimes decisively, is hardly a new idea. The struggle at Cedar Mountain would be shaped by terrain and ground cover and other features, but none of these exceeded in importance the brutal constant verity of the broiling sun.” To that powerful statement, we can now add the fact that our recent findings provide definitive proof that the heat at Cedar Mountain was far worse than either Krick or any other historians likely imagined.
During this time frame, records from the Observatory indicate an eight-day period of extreme heat with daily heat index measurements ranging from a very uncomfortable 95°F to an extremely dangerous high of 109°F. Furthermore, on seven of the eight days the heat index measured over 100°F and on three of these seven days the heat index either equaled or exceeded 106°F. In fact, one day prior to the Battle of Cedar Mountain, the heat index high at the Observatory measured 108°F.
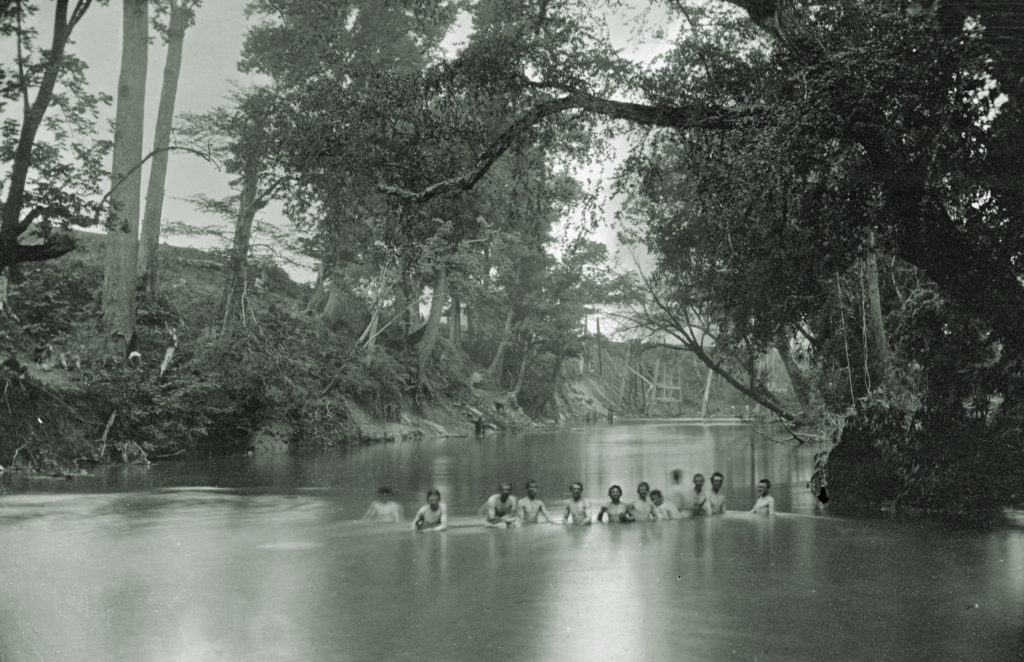
Such a heat index certainly would have resulted in some of the most dreadful conditions to ever face Stonewall Jackson’s famed “Foot Cavalry” as they maneuvered August 7–8 to intercept Union forces prior to the Cedar Mountain fighting. In doing so, they along with their adversaries endured heat indices of 103°F and 108°F on August 7 and 8. And then, on August 9—the day of the battle—the heat index reached its zenith. This was a day Krick aptly described as one of “broiling temperatures—the highest recorded on the day of battle for any major action in the Virginia theater.” To wit, the Observatory air temperature on August 9 that fateful day measured 95°F (a few ticks lower than that listed by a Georgetown observer), but the atmospheric moisture measurement recorded there resulted in a remarkable dew point reading of 76°F and a heat index of 109°F!
This information serves us well in validating accounts like that of the 27th Indiana’s Edmund Brown, who provided a firsthand account of the suffering caused by the extreme heat index experienced by soldiers who served at Cedar Mountain. As detailed in The Howling Storm, Brown indicated that due to the heat, “We saw many (soldiers)…lying on the ground, frothing at the mouth, rolling their eyeballs and writhing in painful contortions.”
Historians often find themselves doubting soldiers’ accounts of the weather when they seem as though they might be exaggerated. But the heat index figures detailed here more than validate accounts such as those of young Brown. All of this must be considered in conjunction with other factors impacting the soldiers’ well-being, such as the availability of water—or more often, the lack thereof, fatigue from prolonged or difficult marches and ongoing exposure to extreme conditions. Add to this a magnified level of discomfort due to wool uniforms, bulky accoutrements, and cotton undergarments. Finally, one must consider the impact of the sun’s penetrating rays. On August 9, it averaged mostly clear skies in Washington and likely at Cedar Mountain as well. In fact, it is very important to note that heat index measurements, or values, are for shady locations. According to NOAA, exposure to direct sunlight may increase the heat index values by up to 15°F.

One note of caution—recall that allowances must be considered for the differences between validated Washington, D.C., Observatory measurements and projected conditions in the vicinity of Cedar Mountain. That said, a cursory look at modern-day comparison data from NOAA, between Washington and Warrenton, Va., 32 miles from Cedar Mountain, the nearest available modern “proxy,” for the month of August, viewed over a 30-year period (1990–2021), indicates very similar average high temperature readings and average precipitation for these locations. Temperature-wise, though the average readings were up to five degrees higher in Washington than Warrenton, this data is almost certainly skewed by the “urban heat island effect” in modern-day Washington. Urban heat islands did not exist in 1862. With this, a more reasonable variance, or margin of error, would be in the 1–2 degree range. Suffice it to say, August 5–12, 1862, was an extremely hot and humid period in Washington and the surrounding areas, typified by dangerous heat index readings nearly unprecedented during the Civil War, including Cedar Mountain and the vicinity.
June 15–18, 1863—The Gettysburg Campaign—Union and Confederate forces on the march in Virginia, Second Battle of Winchester, and Battle of Aldie. If the weather at Cedar Mountain on August 9, 1862, felt like a broiling oven, the weather during an intense, albeit short-lived, blast of heat in Virginia in June 1863 must have felt like hell on earth. Fortunately for the soldiers of both sides, the heavens granted quick relief. But before the heat abated, some of the most dangerous conditions recorded during the war fell upon both armies as they intently moved north toward their date with destiny at Gettysburg.
Records from the Observatory for this four-day period reveal three days of extreme heat with heat index readings ranging from 95°F to an alarming 118°F! Worse yet, the day the Observatory heat index measured a blistering 118°F (with the dew point at an incredible 80°F) was a day of devastating forced marches for some and a day of combat for others, namely those cavalrymen who saw action at the Battle of Aldie. And while the battling horse soldiers clashed amid the staggering heat and humidity, marching Confederate and Union infantrymen and artillerymen faced life-threatening heat-related conditions. Horses and mules would have been susceptible to the extreme heat as well.
Reinforcing all of this, a modern-day comparison between both Warrenton (as a Culpeper proxy) and Winchester, Va. (as compared to Washington) for the month of June (over a 30-year period, 1991–2021), reveals very comparative climate conditions. This data lends itself to the contention that during June 1863 the weather in Washington was likely very similar to that experienced by the armies strung out between Culpeper and Winchester.
While previous accounts of temperatures in the 90s during this overall time frame lend credence to the numerous firsthand accounts of suffering due to extreme conditions, the aforementioned heat-index figures offer new insights to the actual circumstances. Indeed, these figures offer an improved understanding of the primary-source accounts of suffering due to the heat as detailed in highly regarded sources such as Edwin B. Coddington’s The Gettysburg Campaign, Noah Andre Trudeau’s Gettysburg: A Testing of Courage, and Stephen W. Sears’ Gettysburg. Examples include that of the Sergeant Benjamin Hirst, 14th Connecticut infantry, who was part of the Union army’s 2nd Corps forced march on June 17: “We seemed to be suffocating at each step…strong men wilted as though blasted by something in the air.” That something was an estimated 118°F heat index. And a member of the 7th Maine added: “It has been the hardest march in my experience. It was hot; the roads were dusty and filled with trains and the men fell out by the road-side in scores overcome by the heat and exertion. Numbers died from sunstroke.”
But returning to Noe’s fine work, we find one of the most descriptive accounts as conveyed by Sergeant Randolph Shotwell of the 8th Virginia Infantry, “Flesh and blood cannot sustain such heat and fatigue as we have undergone this day. It is terrible! All along the roadside since 9 o’clock this morning I have seen men dropping, gasping, dying—or already dead!” Shotwell continued, “…when one’s clothing is utterly saturated with perspiration mixing with the dust in a grimy paste; and above all, weighs the heavy musket, the muffling blankets, gripping waist band and belt (upon which hang the heavy cartridge and cap boxes) and the chafing canteen straps—is it strange that one sees hundreds of men gasping for breath, and lolling out their tongues like madmen?” In terms of the magnitude of such fallout, one published source indicates that during this time frame, in James Longstreet’s Corps, up to 500 men a day dropped out of the march, with some dying where they fell.
Over the years, accounts like those detailed here led historians to believe the heat was quite extreme during this time frame. And the weather observation data from the Georgetown observer, as detailed in Krick’s Civil War Weather in Virginia, seemed to buttress these conclusions. Yet there was always a degree of uncertainty with regard to the actual conditions.
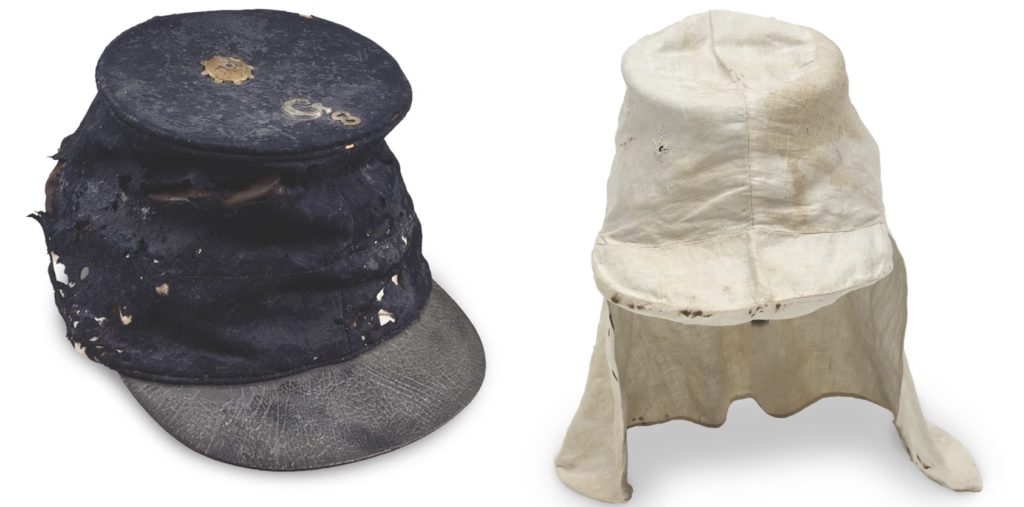
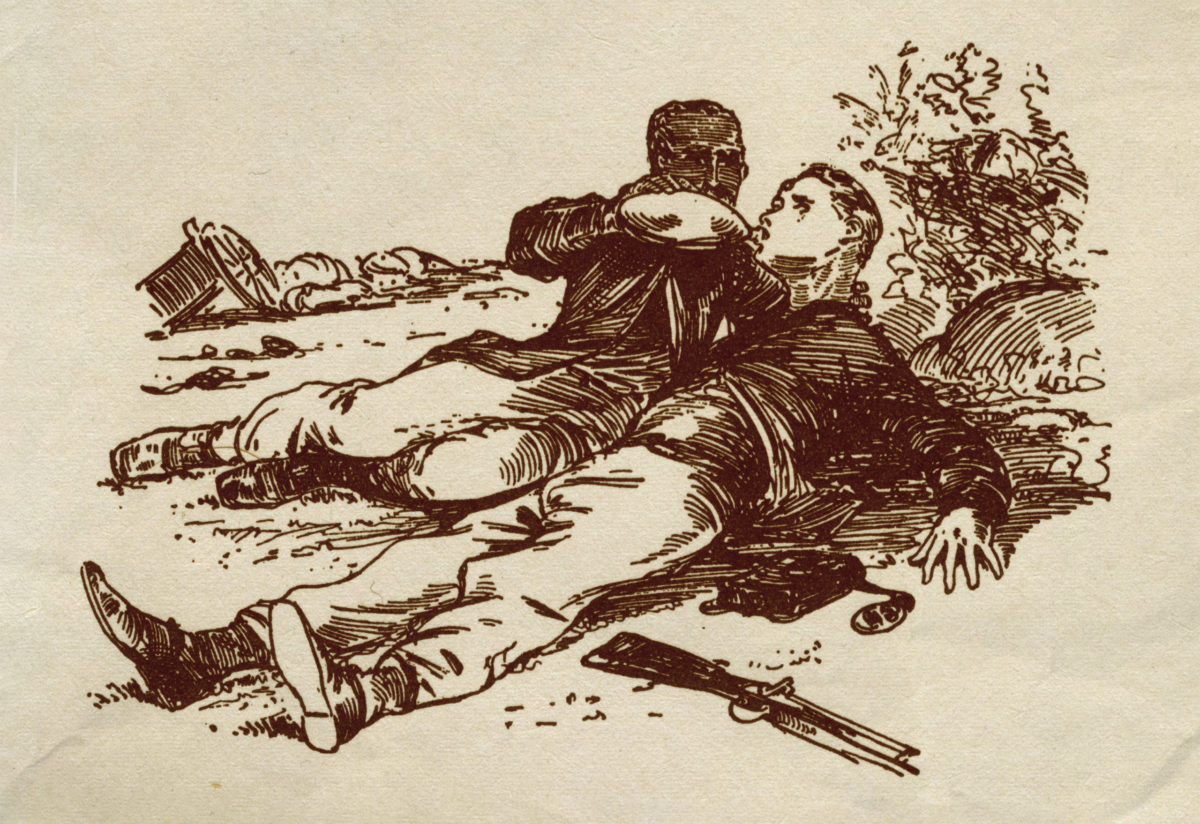
In diaries and letters, and in memoirs written long after the war, soldiers remembered heat as an enemy that attacked both sides. During the march to Gettysburg on the Baltimore Pike on July 1, 1863, a day of moderate temperature but high humidity, the sun beat down on 12th Corps soldiers. “It was a hot day,” recalled a member of Colonel Charles Candy’s brigade, “The sun was hot. The ground was hot, and the men panted like dogs on the chase and sweat and sweltered through clouds of dust that came from Knapp’s Battery in our front.”
Ernest Wait of the 19th Massachusetts wrote of one hard slog, “The sun was now well up and the air intensely hot, causing the persperation to run out and, running down the face, drip from the nose and chin. The salty liquid got into the eyes, causing them to burn and smart and it ran down from under the cap, through the dust and down the sides of the face which was soon covered with muddy streaks, the result of repeated wipings on the sleeves of the blouse.” And 1st Tennessee private Marcus Toney frankly admitted in his aptly named memoir, Privations of a Private, “how many wiggletails and tadpoles I have drunk will never be known,” so desperate did the broiling sun make him for a drink of water.
Fortunately, our recent discovery of weather observation records from the Observatory in Washington allow for a reliable science-based estimation of the dew point and heat index in the aforementioned areas in Virginia during the detailed periods of time. Moreover, this information not only corroborates the previously detailed accounts but adds a new certitude to the understanding of the impact these horrific conditions had on the unfortunate soldiers who experienced the same. In summary, we knew the armies in Virginia, during these time frames, had suffered under severe heat, but now we know it felt much hotter than we ever dared imagine.
Thus, the newly discovered data and the Gettysburg “model” allow for analysis of these examples as well as other instances of extreme heat in Virginia during the Civil War. In addition, primary-source weather observation data is available for other regions adjacent to campaigns and battles in the border states. With this, there is great potential for an increased level of understanding with regard to the soldiers’ suffering from extreme heat and corresponding consequences in relevant actions during the war—not only in Virginia but in other theaters of action as well. And conversely, this data can also be used to contradict accounts of oppressive heat when the actual conditions were not too drastic. One such example was the First Battle of Manassas. But that is another story, for another day.
Jeffrey J. Harding’s career as a Licensed Battlefield Guide at Gettysburg spans 22 years. Jeff is also the author of the recently released and highly acclaimed book, Gettysburg’s Lost Love Story—The Ill-Fated Romance of General John Reynolds and Kate Hewitt. He would like to recognize meteorologist Jon Nese, Ph.D., and retired National Park Service scholar John Hennessy for their assistance in preparing this article.

